Joining the Gobabeb (rogues(?)) gallery of Research Associates

Revelling in being a Research Associate of Gobabeb, or joining the ‘rogues gallery’ (Magg-Kölling, 2023). In 2022 I got back to fieldwork in the Namib Sand Sea, and back to Gobabeb for the first time since two wonderful conferences here in 2012: SASQUA XIX Biennial Congress and the SAAG Biennial Conference.

For this trip I was with a wonderful group of colleagues, George Leader, Rachel Bynoe, Dom Stratford, Kaarina Efraim and all facilitated by the navigational know-how of Eugene Marais. As part of George’s S.A.N.D.S. project, I had been awarded UoManchester SEED funding for sediment sampling and luminescence dating of our first set of samples, most from the site of Namib IV.

Namib IV (S23° 44.829’, E14° 19.720’) is one of few Earlier Stone Age sites in the Sand Sea of the Namib Desert, and a rare example of a tool-rich and fossil fauna-bearing pan system in the Namib Sand Sea. So far the team have published a paper that presents some preliminary results from the first visits to Namib IV.

The ‘green’ dunes of the western Thar

Sunset in the dunes near Bhuwana in the western Thar, Rajasthan.

In September 2023 I took my first trip to the Thar desert, with Shashank Nitundil (now PhD student in the Geography department here in Manchester) who headed here during his MSc in Environmental Monitoring, Modelling and Reconstruction to undertaken his dissertation research. See Nitundil et al. (2023) for an excellent paper that has set up the use of the portable-luminescence reader in this region, based on the training set calibration approach I developed in southern Africa.

XXI INQUA Congress, Rome 2023

Next week the QEG (Quaternary Environments and Geoarchaeology) research group from the University of Manchester are off to Rome for the 21st INQUA Congress, hosted in Rome.

A big thank you to the QRA for an INQUA 2023 Travel Grant!

I’ll be:

(1) Convening Session 183 “Frontiers in Drylands Research” in Thematic Block 2 (Landforms…), which is on Mon 17th July 4:15pm-6:15pm in Room I – Lettere CU003. Posters for our session are earlier in the day from 2:45-3:45pm in Poster Room MAC – Lettere CU003.

(2) Presenting (Oral) in Session 58 “The new challenges for luminescence dating” in Thematic Block 6 (The Quaternary Time Machine), which is on Mon 17th July 11:00am-1:00pm in Room Careri – Fisica CU013. I am speaking at 12:30pm.

(3) Presenting (Poster) in Session 21 “Records of climate change from MIS 3 and MIS 2 in the Southern Hemisphere: The Lynda Petherick Memorial Session”, which is on Sat 15th July, with posters 2:45-3:45pm in Poster Room MUST 1 – Scienze della Terra CU005, and later in the day, there are oral presentations 4:15pm-6:15pm in Room XI Moro – Legge CU002. For this poster “Southern African dryland environments within SHeMAX: Towards terrestrial regional chronostratigraphic frameworks during the last global glacial.” there are some links here of supplementary information.

Table 1: Location of proxy sites on the map (Fig. 1 on poster) and Fig. 2 (on poster).

Table 2: The 10 dryland archive types and their proxies (from Stone (2021))

Table 3: Preliminary chronostratigraphy for the past 64 ka (extracted from 190 ka record in Stone (2021)).

(4) Presenting (Poster) as part of the S.A.N.D.S. team in Session 30 “A multiscale geoarchaeological approach for the interpretation of palaeo-landscapes and human activities”, which is on Sat 15th July, with posters 2:45-3:45pm in Poster Room MAC – Lettere CU003. The poster is led by Dom Stratford.

Scintillating sand, super sand, scarce sand. Save our sand! Go out and shout about sand!

Somehow my research as a Geographer and Quaternary Scientist1 has involved me digging a lot of holes and collecting a lot of sand from deserts. However, it is not so often I get to step back and think about sand found in other environments and about the global importance of sand as a natural resource. There are some immense challenges that are starting to emerge as the result of a scarcity of sand, or at least the scarcity of the right type of sand for the enormous appetite that our society has for all of the many things that have sand as a crucial ingredient.

1 A Quaternary Scientist is someone who investigates the long term workings of, 
and changes to, the environments and climate of the last 2.58 million years.

SO, WHAT IS SAND?

Sand is defined by the size of the particle (0.0625 to 2 mm in diameter) and not the composition (what it’s made up of).

Sand is most commonly made up of quartz (a form of silica) and other silicate minerals, such as feldspar and garnet, as well as bits of broken shell and coral, gypsum, volcanic glass, basalt, and other minerals. If you want to get an idea of the vast variety of types of sand, have a look at this superb Sandatlas site by Simm Sepp for lots of lovely pictures of many different types of beautiful sand.  All of these particles get gradually broken down from bigger rocks (or shells etc.) through time by the action of ice, water and the wind. Most sand grains have undergone a long journey, having been through many rotations around the rock cycle.

sand

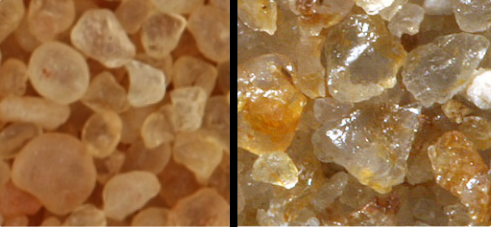
Figure 1. Sand on the left hand side is sand from desert regions, where thousands of years of being blown around in the wind has knocked off the angular edges and rounded the grains. The less round sand on the right hand side with sharper edges is associated with being broken down by ice or water, and will have been bouncing around in the environment for a shorter amount of time (less time to smooth those edges).

Sand can be classified by shape, from spherical and smooth (left hand side in Figure 1) to more oblong and sharp (or angular) (right hand side in Figure 1).

WHAT DO WE USE SAND FOR?

Sand doesn’t just get between your toes and sneak into your bag at the beach. It has quietly (and sometimes very noisily) infiltrated into every corner of the world and our lives – many of which you might not be very aware of. What’s clear is that we can’t live without it, following the types of lives that we are living.

For making GLASS: windowpanes, wine bottles, drinking vessels, spectacle lenses, electric cooker hobs, chopping boards, smartphone screens…


Within CONSTRUCTION: Sand contributes 60 % of the ingredients of reinforced concrete used for buildings (2/3rd of the world’s buildings are made of reinforced concrete) and roads (for a km of motorway, 30,000 tonnes of sand is consumed!).

Inside our ELECTRONICS: Electronic chips use high quality sand (silica) within our computers, phones, stereos, bank cards etc.


To make FILTERS: Filtration of our water supply at sewage works uses sand, as do septic tanks and swimming pool filters.

For SPORTS: golf bunkers might spring to mind. Maybe also beach volleyball, which requires a very specific type of sand crafted from the right range of grain sizes (it can’t have too much fine material, as it gets too stiff underfoot and players suffer injuries). For the London 2012 Olympics 2,270 tonnes of sand were delivered for the beach volleyball event (that’s 20 blue whales, or ¼ of the Eiffel Tower weight of sand!). Which other sports can you name where you see sand quite obviously? Sand is also used within some artificial turf surfaces for a wide range of sports.

In a slightly more hidden source – within PRODUCTS: Sand is key ingredient of silicon dioxide (SiO2): a mineral found in products including wine, cleaning products, paper, dehydrated food, hairspray, toothpaste and cosmetics. Sand is in plastics, paints, tyres… The list is immense.

And let’s revisit construction, in the context of BUILDING NEW LAND: Perhaps the most extreme example of humans using sand is the artificial sand islands that have been created out in the Persian/Arabian Gulf.  For example, Palm Jumeirah cost >$12 billion and used > 150 million tonnes of sand (dredged from the coastline of Dubai). This enormous reconfiguration of land and sea seems somewhat insane, but thanks to the souring price of land in Dubai it was actually cheaper to build more land to build on than buy up what was left to build on! The madness spiralled into ‘The World’, an artificial archipelago made of sand, costing > $14 billion and using three times as much sand as the Palm. This collection of new sand islands has been almost completely abandoned since the 2008 global financial crisis, although in December 2016, there was reported progress of development on the ‘Heart of Europe’ islands. In order finish building ‘The World’ and construct the world’s largest building (Burj Khalifa) Dubai had to import sand from Australia, because they had already used up all of their suitable sand!

HOW MUCH DO WE USE?

The best estimate from the United Nations is that we use around 40 billion tonnes per year. Those sorts of numbers become rather incomprehensible, even employing our Blue Whales and Eiffel Tower equivalents! (200 million Blue Whales and 5 million Eiffel Towers).

Eye-openingly, this is twice the amount of sand moved by all of the rivers of the world in one year. This makes humans the largest transforming force on the planet when it comes to shifting sediment about.

Sand is the 2nd highest used raw material on Earth, and that’s a second only to water! We use at least 5 times more sand than we use coal every year.

SandAnd the point to shout about, to anyone that will listen, is that we are using sand far far far more quickly than it is getting replenished (naturally produced within the environment). We are mining it unsustainably, and there are vast environmental consequences!


WHERE DO WE GET OUR SAND FROM?

So where is all of that sand coming from? And this is where I learn that the beautiful seas of sands within deserts2 should be safer for a little longer.

2It has been found that desert sand is not actually the right kind of sand for
 much of human usage. It is too smooth and too round for construction, it doesn’t
 stick together. It is so smooth and round because as the wind blows the sand
 around in the desert, the sharp edges are knocked off. In water there is a very
 fine film of water, which reduces the amount the grains rub against each other 
and removing the sharper edges. How round a grain of sand gets also depends on the 
amount of time it has been moving around since it was eroded from a larger piece
of rock (shell, coral, etc.).

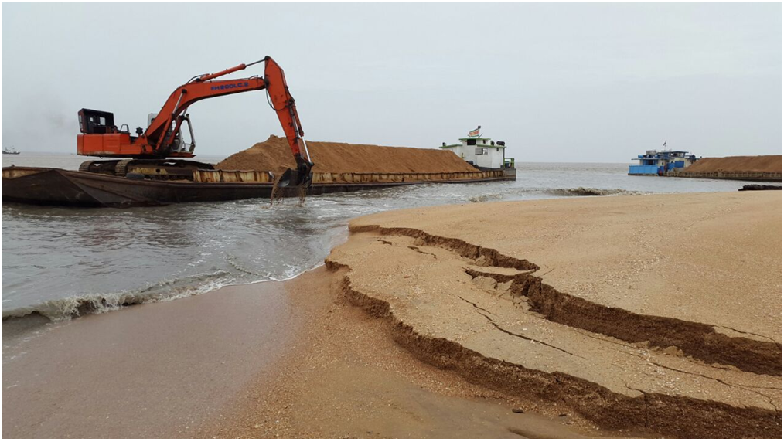
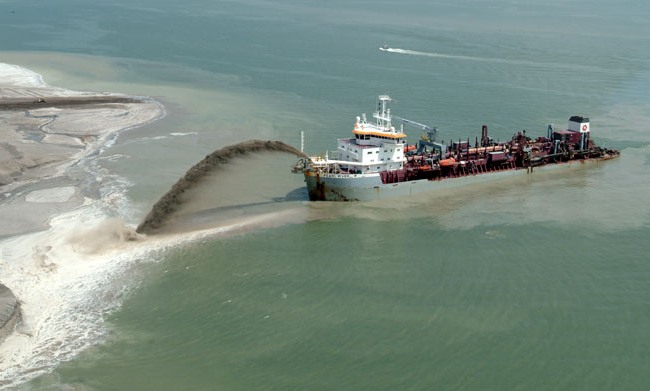
Initially most sand came from quarries, just like the sand quarries that are found close to the BlueDot festival site here in Cheshire, and dredged from rivers. However, as demand has increases there has been a huge shift to:

  • coastal beach deposits (LH side below)
  • dredging sand from the ocean floor (RH side below)

beach miningsand dredger

ENVIRONMENTAL CONSEQUENCES OF THE GLOBAL APPETITE FOR SAND

There consequences of removing 40 billion tonnes of sand per year and turning it into built urban infrastructure, and new islands, and billions of products, is that the size of the land that was made of sand is decreasing in extent. That means disappearing beaches, or whole islands. That means increased erosion in rivers, leading to bridges being undermined. That means shrinking deltas. That means huge disruption on the sea bed from mining via sand dredging. That means losses of river, delta and marine habitats and ecosystems.

DEADLY WARS AND SAND MAFIAS!

Placing restrictions of the extraction of sand has led to an extensive underground network of criminal activity. Criminals, illegally digging up, transporting and selling sand.  In India, the ‘sand mafia’ controls an illicit marker of a head-scratching $2.3 billion per year!

https://blogs.wsj.com/indiarealtime/2013/08/06/why-india-has-a-sand-mafia/

http://www.abc.net.au/news/2017-03-28/the-great-sand-heist-fuelling-india-120-billion-building/8390984

SAVE OUR SAND – WHAT ARE THE ALTERNATIVES?

Building using recycled concrete materials and also using more wood, bamboo and straw.

Increased rates of recycling of sand-rich products, such as sand.

We can even produce sand for construction from recycling glass!

Ultimately in a world run by profit and large corporations, perhaps the Placing a higher cost on sand, and incorporating the environmental costs, as a disincentive to its over-mining. But, as we see from the sand mafias, this just pushes the problem into the non-formal sector. So it looks like we need a more fundamental shift in the sands, and that is a shift away from the reliance of modern society on sand!

So. Please.

Go shout about sand!

Even for a minute or two. Talk to your family, your neighbours, your friends. There is a huge gulf (of missing sand) between the huge size of the problem of over-mining the Earth’s sand and the size of the public awareness of the problem(s) (and the size of these beautiful tiny particles).

—–

To learn more, watch Sand Wars, a film by Denis Delestrac.   http://sand-wars.com/

Blue dotting across/ within the universe – A weekend of science and music

This weekend, I’m off to my first BlueDot festival with a bunch of fantastic colleagues from the Department of Geography at the University of Manchester. That’s Dr Emma Shuttleworth in the photograph humouring me by allowing me to take a test-ride inside one of our new carts that will transport our equipment onto the site. If you don’t know what BlueDot is, I’ll try to capture it in a sentence… It’s part of the summer festival line-up that the UK does so well, and one with a twist – it’s not just about the music, it’s a celebration of science and discovery. It’s an all-out geek fest/festival of superb exploration, set within the grounds of a deep space observatory (bonus sentence). Selling it?

To turn to the website for 2017, this year is about the uncertainty and fragility of our environment, here on planet Earth, that Pale ‘Blue Dot’, photographed from outer space by the Voyager 1 space probe on February 14th ,1990. The message from the festival this year is a powerful one, and I’ll share it with you here.

"In an era of political divisiveness and environmental uncertainty, 
bluedot aims to cultivate a unifying celebration for citizens of the world. 
Its 2017 message is loud and clear: look again at that dot.
That’s here. That’s home.
 That’s us. (Carl Sagan, 1934—1996).

OUR MISSION
To inspire and entertain.
To explore the frontiers of human advancement.
To celebrate science and the exploration of the universe.
To explore the intersections of science, culture, art and technology.
To highlight the fragility of planet Earth. "

At the heart of the festival is a commitment to the environment, and I’m delighted to see Teresa Anderson’s (Director at Jodrell Bank) post a blog this week outlining the festivals commitment to REDUCE THE PLASTIC IMPACT this year!  This means, no single use plastic straws or cutlery and banning plastic bottles on site. So pack your own water bottle in your rucksacks (or buy a beautiful re-usable BlueDot metal one at the festival) and pack some cutlery to use for the whole weekend! Why not a bamboo coffee cup too for your hot drinks! This will help reduce the amount of plastic that ends up chocking the environment, particularly the oceans, and entering the food chain.

The topic of plastics is a perfect segue to tell you more about what the merry band of Geographers are hoping to talk to you about at the festival. Our stall is ‘The Day After Tomorrow – Living in the Anthropocene’ and will feature an  activity where you can search for and identify (micro)plastics yourself with our microscope. 

Over the three days of the festival we’ve got lots of exciting activities that showcase our work on how humans impact and interact with the environment. Pick up your ‘Citizen of the Anthropocene’ sticker, step into our Anthropocene passport control to pick up your passport and collect stamps (we count 7 in our planning meeting today) as you start learning about how you are living in the Anthropocene.*

  • We’ll be going back in time to investigate the legacy of pollution from the Industrial Revolution in the NW.
  • We’ll be exploring how we still use the natural resources of the local area (look out for me dressed as a golfer and carrying lots of little pots of sand) and discussing how sand is a much rarer natural resource than you might think!
  • You can search for, and identify, tiny pieces of plastic (a clear ‘marker’ for the Anthropocene) using our microscopes.
  • You can look down microscopes at the tiny fossils we use to learn about past climates.
  • We’ll be calculating the carbon footprint of your journey to the festival and discussing how these can be reduced or offset.
  • Find out about University of Manchester Geographers are tackling peatland restoration along with Moors for the Future Partnership.
  • We’ve also teamed up with our friends at Play Fuel who have developed a street game ‘Downpour’ based around our research on flood mitigation. You can play to try to beat the clock to save Manchester from the next big flood!

You can read more in the official festival programme about what the Anthropocene* is, and please come and talk to the team during the weekend if you are at the festival. Pick up your sticker and collect a stamp from each of our activities over the weekend for your Anthropocene passport! We are looking forward to meeting you! I’ll post a sand-resources related blog next, if, like me, you are particularly interested in these tiny particles.


I’m riding down to the festival site on this trusty cargo-bike steed, and I currently feel a little on the wobbly side, so if you see me on route, please send me a supportive thought (don’t honk your car horn, as I might just overturn). It’s very long. Thank you to Triangulum and SEED social responsibility for partnering up so that I can hire this free of charge! If you want to try one out too, have a look here.


*The Anthropocene is the idea that human activities have influenced the environment to such an extent that traces of these activities will remain visible in the sediment and rock record for millions of years to come. To justify the definition of a brand new ‘epoch’ (to use the geological terminology), these impacts must be sufficiently distinctive to what has come before.

Tracing sources of nitrate above the water table in dryland dunes…

It was whilst investigating how much rainfall seeps down through desert dunes down to groundwater supplies in the Stampriet Aquifer Basin in southern Namibia that I and my late co-author Mike Edmunds also discovered elevated levels of nitrate in the moisture within the dunes (see Stone and Edmunds, 2012; 2014). When I say elevated levels of nitrate, concentrations of nitrate were up to 100-250 mg/L and 250-525 mg/L (expressed (NO3-N), nitrate as nitrogen (see note 1)) in two sand dune profiles. See the graphs on the poster below, or have a look at Figure 4 in Stone and Edmunds, 2014. This is newsworthy, and of concern, because these levels of nitrate represent poor water quality. The WHO (World Health Organisation) state a maximum safe limit for nitrate in drinking water of 11.3 mg/L NO3-N. This means were are finding levels 10 to 50 times higher than this safe limit. So why is this a problem? Well, nitrate is both toxic to, and readily absorbed by, humans and animals (see note 2).

We had already discovered that water from rainfall was moving through the dunes at a significant, and quantifiable, rate of between 4-5 mm/y and 20-27 mm/y (representing between 1 and 14% of mean annual rainfall in the area) (see note 3). This means that these high concentrations of nitrate are also advancing toward the vital groundwater supplies at a significant rate, reaching the base of 12 m high dunes in around 20 to 60 years.

This provides us with a strong incentive to understand how widespread these elevated levels of nitrate are, and whstone_edmunds joae paper
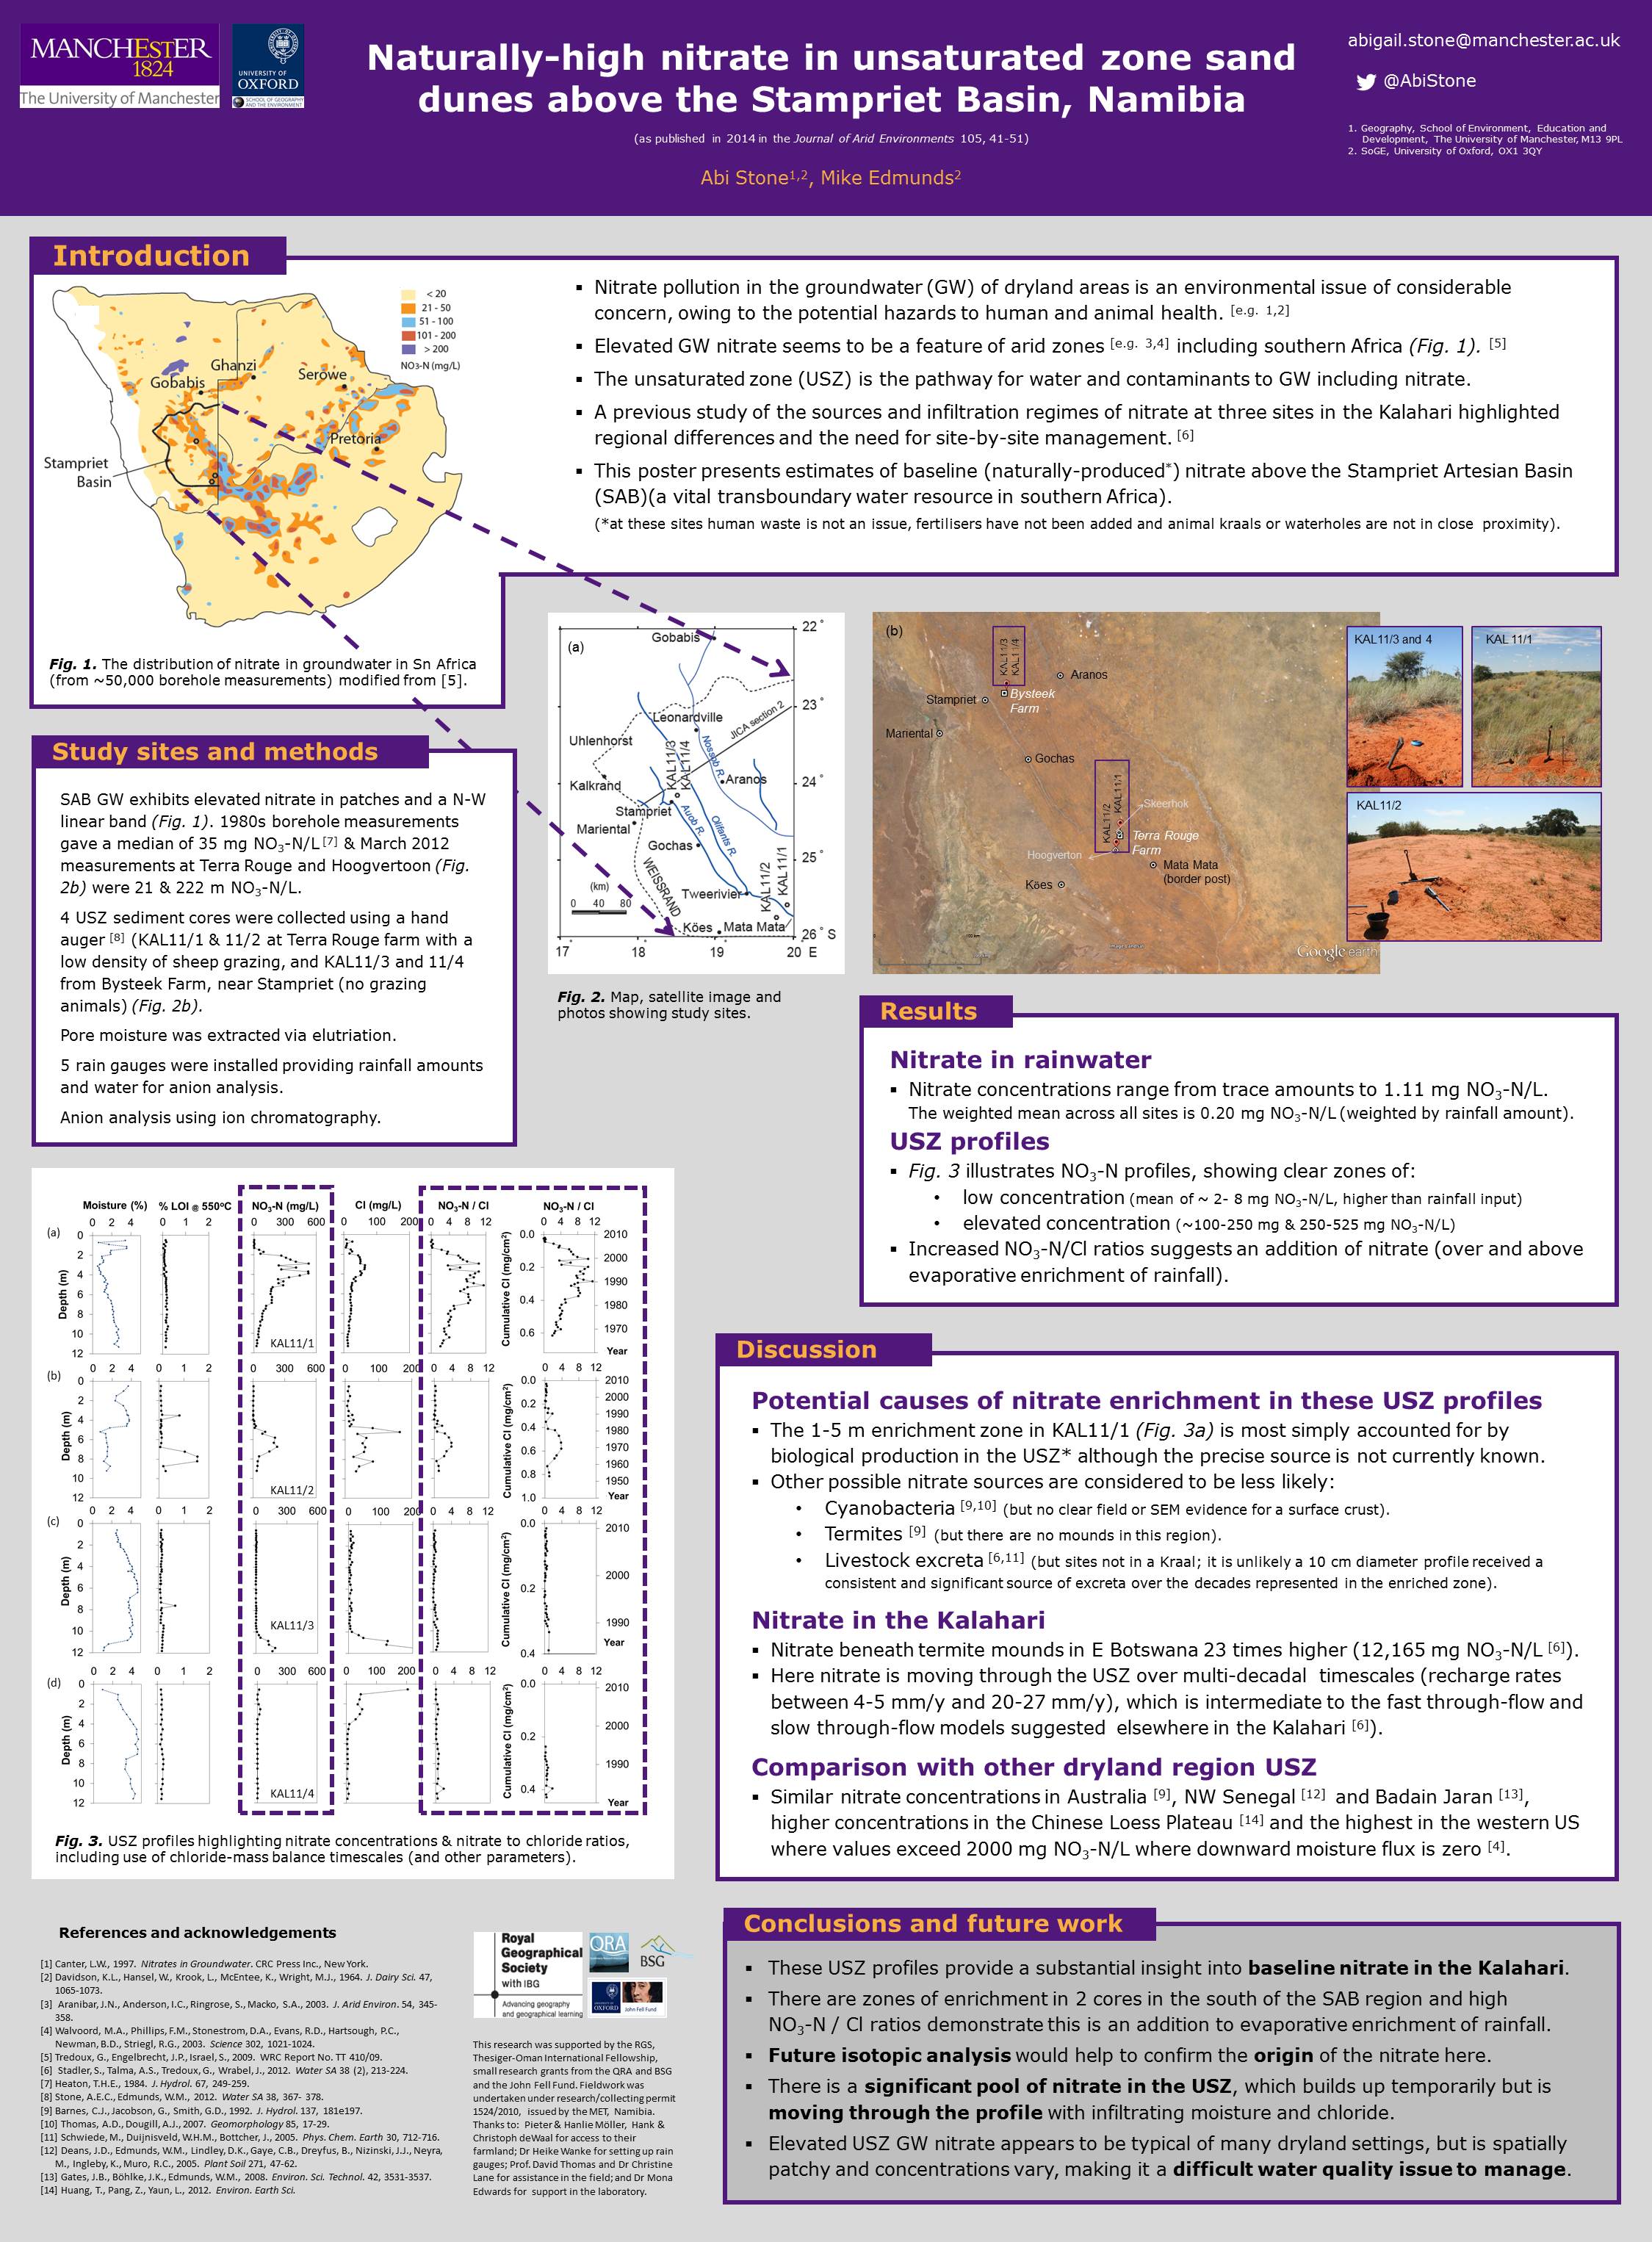
ere they are originating from. From an assessment of the setting itself, we suggested in 2014 that a natural origin was most likely. The land-owner in this region does not add any fertilisers to the land and uses the land for low density sheep grazing. We considered that a source from the sheep (their urine and faeces) was unlikely, owing to (i) the sampled sites being well away from animal enclosures and (ii) the depth of elevated nitrate within the profile representing accumulation of nitrate over a timescale of decades. It seems too improbable that a sheep, or collection of sheep, would select a 10 to 20 cm diameter target on the top of one dune as a long-term latrine! Our most probable explanation remains a source from N-fixing vegetation. In the Kalahari, such N-fixing forms of vegetation include Acacia trees and grasses (such as Stipagrostis amabalis, Schmidtia kalihariensis and Arstida congesta). Whilst the sites we sampled are not close to Acacia trees, there are some grass species present.

One good way to better constrain the potential source(s) of nitrate is to measure the isotopes of nitrogen (N) and oxygen (O) in the nitrate. This allows us to identify contributions from the atmosphere, fertiliser, manure/sewage and soil (with some overlap between manure and soil). The presence of nitrate in soil occurs by fixation of nitrogen by bacteria in the nodules of vegetation roots, or by cyanobacteria, or within the guts of termites.

For this reason I am working with the NIGL (that’s the Natural Environmental Research Council Stable Isotopes Facility) to measure the isotopic composition of the nitrate in my samples. The project ‘Nitrate beneath the surface in drylands’ involves a phase of fieldwork in March-April 2016 to collect fresh samples, funded by the University of Manchester, and analysis that I will undertake with Tim Heaton, Angela Lamb and Andi Smith in Keyworth, which is funded by NIGL.

We will be providing detailed analysis of nitrate across a 10 km by 5 km region of the southern Kalahari above the Stampriet Artesian Basin, with around 12 to 15 profiles through the dune sediments collected. Samples will be taken at at least 50 cm vertical resolution down to 12 m depth to build up a detailed picture of the origin and transport of the nitrate down toward the groundwater table.

This research will help to fill a gap in understanding between the production of nitrate in drylands as part of the nitrogen cycle in the surface soil-plant system, and the presence of high nitrate concentrations in the groundwater supplies. We have very little understanding of what happens to nitrate between the surface soil and groundwater. And as outlined above, the stable isotope analysis will help us to constrain the origin of these high nitrate concentrations from a range of possible sources, including those that can be considered a natural baseline and those that constitute anthropogenic pollution. This is important for effective land-use and groundwater resource management.

Watch this space for updates to the field campaign, where I will be collecting sediment profiles through the sand dunes, and samples of water from boreholes with the assistance of dryland environmental PhD student, Jerome Mayaud.

                                        Sampling the Kalahari sand dunes in 2013. 

——–

Note 1: It is a common  convention to express nitrate (an anionic form of nitric acid as a salt) as an equivalent value of nitrogen (the chemical element N). For example, the WHO (World Health Organisation) use this way of expressing the concentration of nitrate, and they state a maximum limit for nitrate in drinking water of 11.3 mg/L NO3-N.

Note 2: The health hazards of ingesting too much nitrate include gastrointestinal disorders in the short term. In the long-term it is carcinogenic, and causes a blood disorder methemoglobinemia. See the WHO background document for more information http://www.who.int/water_sanitation_health/dwq/chemicals/nitratenitrite2ndadd.pdf

Note 3: Discovering that rainfall was making it through the dunes and contributing to recharge of groundwater supplies was a significant finding in itself. If we want to be able to assess the sustainability of groundwater resources we need good date on the input of water (recharge) in addition to the outputs (utilisation). Direct recharge through the dunes is a pathway in addition to the well-defined focused recharge pathways through sinkholes in a calcrete surface to the north and north-west of the basin.

Related research publications (please email me for further details)

Stone, A. E. C., Edmunds, W. M. (2014) Naturally-high nitrate in the unsaturated zone sand dunes above the Stampriet Basin, Namibia. Journal of Arid Environments 105, 41-51.

Stone, A. E. C. and Edmunds, W. M. (2012) Sand, salt and water in the Stampriet Basin,Namibia: Calculating unsaturated zone (Kalahari dune-field) recharge using the chloride mass balance approach.Water SA 38(3), 367-377.

INQUA 2015

IMG_1050The XIX INQUA Congress has just begun in Nagoya Japan, graced this morning by their majesties the Emperor and Empress of Japan. See the website http://inqua2015.jp for information about the conference and link to the Programme Book (it’s a fairly big PDF file) to see what the scientific sessions and talks are all about.

I have a poster on Wednesday in Session S08 Innovative Development and Applications in Quaternary Geochronology about the portable luminescence reader ‘Rapid age assessment in the Namib Sand Sea using a portable luminescence reader’  and a talk on Saturday  at 10.00 in Session T02 Palaeohydrology and fluvial archives (the last talk in the session) ‘Unsaturated zones as archives of past climates: a review of progress in providing a novel proxy for dryland continental regions’. 

QRA logoMany thanks to the QRA for an INQUA Congress Fund award that has helped toward my attendance of this conference.

INQUA Congress Fund

Speed dating?

UntitledLuminescence dating provides an estimate of the time that has elapsed since a sediment was last exposed to daylight. This makes it an extremely valuable technique for dating landforms deposited by the wind, rivers and glaciers. Put in slightly more technical terms it uses a light-sensitive signal that has built up in sand grains from exposure to background radiation (see this acceisble quick fact sheet and this excellent set of guidelines written by Geoff Duller). It has an applicable age range from 10 to 500,000 years, depending on the type of sediment and the amount/rate of background radiation it has been exposed to.

However, as any luminescence dating practitioner is only too aware, the dating process is time consuming and complicated process, involving lots of time in a subdued-light laboratory, a reasonable volume of chemicals (to refine your sample down solely to quartz or to feldspar-dominated fractions) and some pretty expensive and weighty bits of analytical kit. For this reason a number of researchers have been developing ways to assess the depositional age of materials more rapidly. This rapid assessment of age might be particularly useful in the early stages of working out the approximate age of new sites, or if the  research project is focussed on understanding landscape dynamics during a particular time period, such as the late Holocene or the Last Glacial Maximum. To make the dating process more speddy we can either:

1) reduce sample preparation time, or   2) reduce sample analysis time.

In a little more detail, methods include:

  • Luminescence ‘profiling’ in which initial measurements of luminescence behaviour are taken on samples undergoing no, or minimal, chemical pre-treatment (minimising sample preperation time) and this guides the longer, more laborous process of full dating (e.g. Sanderson et al., 2003; 2007; Burbidge et al., 2007).
  • Streamlined chemical pre-treatment for range finder ages (e.g. Roberts et al., 2009; Durcan et al., 2010) again to speed up sample preparation to make initial estimates of ages to guide subsequent full dating procedures.
  • Standardised growth curves, which is an approach to speed up the measurement side of the process rather than sample preparation. It uses fully pre-treated samples but takes fewer analytical measurements for any new sample collected, basing interpolations on an established standardised curve from previous sample (e.g. Roberts and Duller, 2004; Telfer et al., 2008; Yang et al., 2011). This requires some initial effort to build the training curve first, but once established for a region means short amounts of analysis time needed.
  •  Portable luminescence readers (e.g. Sanderson and Murphy, 2010; Kinnard et al., 2011; Stang et al., 2012 and others). These amazing bits of kit measure sediment as it is found in the field (so no sample preparation) and take minute-long measurements of the light emission intensity (rather than many hours to days in the laboratory).

A version of a portable luminescence reader made by SUERC.

So this brings us up to the rationale of what we were doing in this study… Using one of these portable luminescene readers (photo) to make rapid age assessment – our speed dating. It both reduces sample preparation time (we put bulk material as collected in the field in the petri dish and close the door) and reduces sample analysis time (2 blocks of 1 minute, rather than days). However the measurements are instantly transferable to sample age. Therefore, we wanted to see how far we could get toward turning the intentisty of the light signal measured in the portable reader into a rough estimate of actual sample burial age…

So. I chose samples which I had slavishly previously dated using both full sample preparation (to quartz in this case) and full established measurement protocols on which to also measure using the portable luminescence reader to make the comparison. We chose to take a very simple approach to the comparison – that of  making a linear regression of the portable reader signal intensity against established sample burial age (using full dating). The samples chosen span three broad groups of ages (modern, very late Holocene and last interglacial). The relationship between portable reader signal and age was then defined and tested using a second group of samples that had not been used in the regression.

regressions
Regression of portable luminescence reader signal (the post-IR BLSL signal) against sample age (both on log axis), which can be used to predict unknown sample ages from their portable reader signals.


The result? The regression is very good suggesting that sample burial age drives the portable reader signal more than other potential factors (which include different mixtures of sediment compostion). This may be because the sites we have chosen, all inside the Namib Sand Sea have a common sedimentary origin.

A word of caution. We are not advocating that this should be done instead of full optically stimulated luminescence dating, with full sample preparation and full analytical protocols (time-intensive as it is, including lots of time in the dark laboratory). Rather, this research has helped to establish the utility of the portable reader to make rapid age estimates in the field, which help us in the field to develop guided sampling strategies when we are addressing particular research questions. For example, if the question was ‘how dyanmic was dune accumulation and migration over the past 5,000 years’ we could rapidly make measurements on small amounts of material in the field to target those parts of the 34,000 km^2 of the Namib Sand Sea that were about 5,000 years old or less. Then we would need only to sample those areas and depths into the sand dunes. This means less sampling in the field, much less material to pack up and ship them home for full analsysis. This is good because sediment samples are heavy and expensive to transport, and we would have also wasted a lots of laboratory time and chemicals preparing the samples and analytical time measuring those samples not relevant to the time frame we are interested in. Why collect, sieve, treat and measure more sand that you need to?

See this link for our full paper in Quaternary Geochonology and

a condensed poster version  for a simpler version of the story.

On a related note, what is the future potential for these bits of kit? It’s not overblown to say they could be out of this world, with a number of groups of luminescence scientists working at developing an instrument that could be used on space missions of the future to our red planet neighbour and beyond…

For example, see PhD project of Maizakiah Abdullah and this presentation by Yukihar and Mckeever

Tufa carbonates of the Naukluft Mountains

The tufa cascade towering over the landscape at Blasskranz farm in the Naukluft Mountains

The tufa cascade towering over the landscape at Blasskranz farm in the Naukluft Mountains

There has been a recent small flurry of re-interest into the application of OSL dating to sediment trapped in freshwater carbonates, such as:

1) Ribeiro et al. (2014) OSL dating of Brazilian fluvial carbonates (tufas) using detrital quartz grains. QI (online view)

2) Ibarra et al. (2015 in press)  Fluvial tufa evidence of Late Pleistocene wet intervals from Santa Barbara, California, U.S.A. PPP (in press)

Which build on the early work of Rich et al. (2003) Optical dating of tufa via in-situ aeolian sand grains: a case example from the Southern High Plains. QSR 22, 1145-1152.

This has got me thinking. It would be a good time to revisit the Naukluft Mountains of Namibia and see if there is any role for luminescence dating to complement the younger-end of the wonderful deposits in the Naukluft Mountains, which I worked on with Peter VanCalsteren, Louise Thomas and Heather Viles back in 2006-2010.

http://www2.open.ac.uk/ou-usf/Projects%20files/Namibia.htm

Stone, A. E. C., Viles, H. A., Thomas, L., van Calstern, P. (2010). Can 234U-230Th dating be used to date large semi-arid tufas? Challenges from a study in the Naukluft Mountains, Namibia. Journal of Quaternary Science 25(8), 1360-1372.

New 3rd year Optional Course Unit @GeographyUOM ‘Dryland Environments: past, present and future’

[This post is aimed at current 3rd years (and MGeog students) who might still be finalising their decisions about semester 2 optional course units. Also current 2nd years who might be mapping out the pathway they want to take for the next two years.]

IMG_2110

camel and tank - U.S. Army photo by Sgt. Marcus Fichti; Creative Commons license. (Top, or LH side) Northern Namib Sand Sea dune, with green ribbon of trees in the Kuiseb River valley in the foreground (taken by Abi at the Gobabeb Research Centre). (bottom or RH side) Camel v. tank. Are these two of the popular images that spring to mind when you hear ‘desert’ or ‘dryland’. (U.S. Army photo by Sgt. Marcus Fichti; Creative Commons license)

“I've been through the desert on a horse with no name
 It felt good to be out of the rain…”

Most people, even if they are not familiar with this Dewey Bunnell lyric, have a picture of the desert: hot and dry, a landscape of rolling sand dunes, a herd of camels, or a threatening wave of land degradation that grabbed the imagination of the international community in the 1970s and led to the first effort in 1977 to tackles this through the Plan of Action To Combat Desertification (PACD). The topics you will study through this Optional Course Unit will help you to see beyond these stereotypes and understand the wide variety of conditions that are encapsulated in the dryland environments of the Earth. It may also get you thinking interplanetary and casting your eyes into space towards Mars. You’ll soon add Ralph Alger Bagnold to your list of desert Ralphs (Fiennes, playing a mysterious stranger recovering from a narrow miss with a crashing plane in a desert landscape of north Africa in Minghella’s 1996 dramitisation of The English Patient).

Deserts: A Very Short IntroductionIf you want to read something  to whet your appetite whilst deciding whether you’d like to choose this option, Nick Middleton (presenter of ‘Going to Extremes’) has written an excellent little book ‘Deserts: A Very Short Introduction’.

The key characteristic of dryland environments from a physical geography point of view is aridity, which is not only a function of the amount of rainfall (and other forms of moisture input) but relates to a deficit in the ‘water balance’, where levels of potential evapotranspiration are often extremely high. Dryland environments have distinctive characteristics in their atmospheric, lithospheric, hydrospheric and biospheric components. As a result there are a set of geomorphological processes and landforms that differ to those found in a glacial environment, or the temperate and drizzly environment of Manchester. However, if sand seas only make up around 38% of dryland regions, then what does the majority of most deserts look like? Drylands are far from homogenous, with a great diversity of landscapes making up this 47 % of the earth’s land surface, and providing home to more than 850 million people. In addition, have the dryland regions of the present time always been this way? Numerous sites of prehistoric occupation and rock paintings depict parts of the Saharan region teeming with elephant, rhinoceros and hippopotamus and fossils of aquatic fauna record dispersals of animals through a series of lined lakes, rivers and inland deltas across this region more than once over the last 125,000 years.  And what of the relationship between people and dryland environments today? The emphasis on desertification as the perhaps the greatest environmental threat to the planet 40 years ago may have been superseded by other harmful aspects of human activity. But what are the major challenges that people face living in drylands in the 21st Century, in terms of geohazards and resources such as groundwater?

Antoine de Saint-Exupéry on What the Sahara Desert Teaches Us About the Meaning of Life http://charterforcompassion.org/node/7067

In the lectures, seminars and practicals of this course, we will explore answers to some of these questions, and consider and generate many other questions. I hope you will discover the diversity of dryland environments beyond an image of a camel against a sand dune backdrop, and like de Saint Exupery’s Little Prince, and decide for you ‘what makes the desert beautiful’, in the process of learning about it’s physical geography.

The course aims to provide an understanding of the physical characteristics of deserts and drylands. Why do they look as they do, and what processes are responsible for this? We will investigate geomorphological processes (both from the action of the wind and the action of water) and geomorphological features in the landscape (such as dunes, lake shorelines, gravel plains) and consider the interactions between wind, water, sediment and vegetation.

We will also dig into the past to understand something about the nature of past environmental conditions and changes in these regions over long (Quaternary timescales) in response to changing climatic conditions. Some desert regions have been appreciably ‘greener’ during points of the past. Within this part of the course you will develop a critical appreciation of some of the methods used to reconstruct environmental change, which links nicely with the second year module on Environmental Change and the third year module on Ice Age Earth.

The course also allows you a chance to consider the ways in which humans interact with dryland environments and particularly current and future pressures on natural resources and geohazards.

There will be a hands-on component with three practical sessions (sediments, water and making sand glow in a portable luminescence reader, which tells us how long since it was last exposed to light! – so a burial history), and if the logistics permitwe’ll go and see some (non dryland) sand dunes up by the coast near Formby…

If this sounds interesting to you, the course outline is available via University channels (Blackboard etc.) and I’d be happy to talk a little more to you about it. Follow snippets of interest with hashtag #DPPF2015 that I am posting on twitter (@AbiStone)